

Table of Contents
- Introduction to Charts
- Managing Saved Charts
- Interactive Chart Interface
- Chart Types
- Drawing Tool Features
- Saving and Exporting
- Comparing Assets
- Tips for Effective Chart Analysis
Introduction to Charts
Fidenly provides powerful interactive charting tools for technical analysis. You can save up to 20 custom charts and access a comprehensive set of drawing tools, technical indicators, and customization options.
Managing Saved Charts
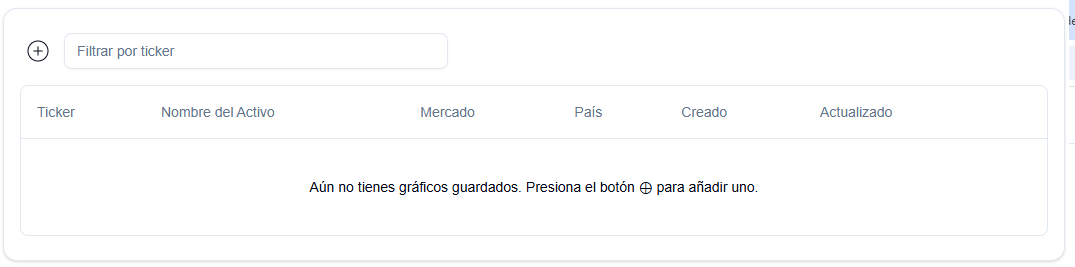
Your saved charts are displayed in a grid view where you can:
- View saved charts - See all your saved chart configurations (maximum 20 charts)
- Add new chart - Click the ⊕ button to create a new chart
- Access charts - Click on any saved chart to open it in the interactive chart view
Each saved chart preserves your:
- Selected asset and timeframe
- Drawing tools (trend lines, Fibonacci retracements, etc.)
- Active technical indicators
- Chart style and customization settings
Interactive Chart Interface
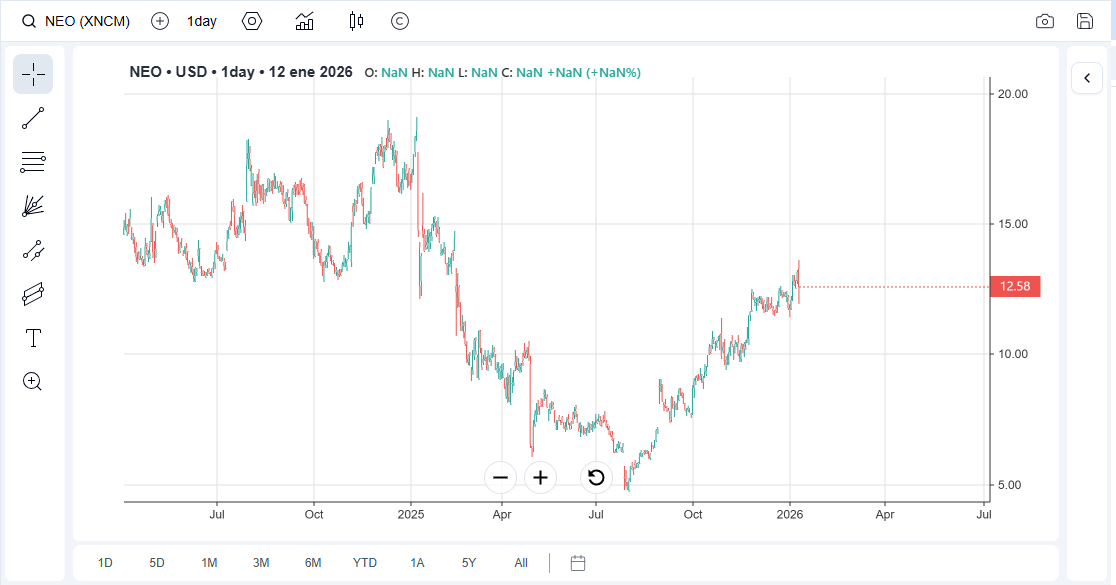
The interactive chart provides a full-featured trading chart experience with multiple toolbars and customization options.
Chart Menubar (Top)
The top menubar provides quick access to essential chart functions:
- Chart Type Selector - Switch between candlestick, line, area, bar, OHLC, Heikin-Ashi, Point & Figure, Renko, scatter, and bubble charts
- Timeframe Selector - Choose your preferred interval (1m, 5m, 15m, 30m, 1h, 4h, 1d, 1w, 1M)
- Indicators Toggle - Enable/disable technical indicators
- Save Chart - Save your current chart configuration
- Snapshot - Export chart as image
- Compare - Compare multiple assets on the same chart
- Settings - Open chart customization settings

Drawing Tools (Left Sidebar)
The left toolbar provides drawing and annotation tools:
Drawing Tools
- Cursor - Default selection tool (Escape key)
- Crosshair - Precise price and time tracking
- Trend Line - Draw trend lines (T or D key)
- Fibonacci Retracement - Plot Fibonacci levels (F key)
- Gann Fan - Draw Gann fan angles (G key)
- Channel - Equidistant parallel channels (C key)
- Standard Deviation Channel - Regression-based channels (S key)
- Text - Add text annotations (X key)
Additional Tools
- Zoom Reset - Reset chart zoom to default view
- Unlock All - Unlock all locked drawings
Keyboard Shortcuts:
- Delete key - Remove selected drawing
- Escape - Cancel drawing mode
- T/D - Enable trend line drawing
- F - Enable Fibonacci retracement
- G - Enable Gann fan
- C - Enable channel
- S - Enable standard deviation channel
- X - Enable text annotation
Indicators Panel (Right Sidebar)
Click the chevron button on the right side to expand the indicators configuration panel. The panel shows:
- Active indicators count badge - When collapsed, displays number of active indicators
- Indicator settings - Customize colors, periods, and display options for each indicator
- Toggle indicators - Enable/disable indicators individually
Available Technical Indicators:
- EMA (Exponential Moving Average) - Configurable period and color
- Force Index - Momentum oscillator
- MACD (Moving Average Convergence Divergence) - Trend-following indicator
- ATR (Average True Range) - Volatility indicator
- RSI (Relative Strength Index) - Momentum oscillator with overbought/oversold levels
- Elder Ray - Bull and bear power indicator
- Stochastic Oscillator - Momentum indicator with K and D lines
- Volume Profile - Price-volume distribution
- Bollinger Bands - Volatility bands
- Parabolic SAR - Stop and reverse indicator
- Volume - Trading volume bars
- Watermark - Custom watermark overlay
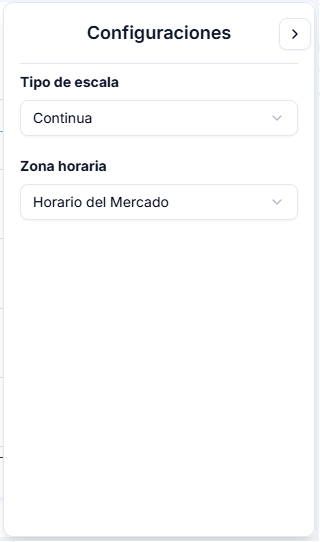
Display Settings
Customize your chart appearance:
- Grid Lines - Toggle chart grid visibility
- Crosshairs - Enable/disable crosshair cursor
- Tooltip - Show/hide price information tooltip
- Hover Tooltip - Display details on hover
- Zoom Buttons - Show/hide zoom controls
- Legends - Display indicator legends
Timeframe Toolbar (Bottom)
Quick timeframe selection:
- Intraday: 1m, 5m, 15m, 30m, 1h, 4h
- Daily/Weekly/Monthly: 1d, 1w, 1M
- Custom date range - Select specific start and end dates
Chart Types
Switch between different chart visualizations:
- Candlestick - Traditional OHLC candles with configurable colors
- Line Chart - Simple close price line
- Area Chart - Filled area under price line
- Bar Chart - OHLC bars
- OHLC - Open-High-Low-Close bars
- Heikin-Ashi - Smoothed candlestick patterns
- Point & Figure - Price movement patterns
- Renko - Fixed-size price bricks
- Scatter - Data point visualization
- Bubble - Volume-weighted data points
Drawing Tool Features
Trend Lines
- Multiple line styles (solid, dashed, dotted)
- Customizable color and thickness
- Ray, line, or segment types
- Lock/unlock for editing
Fibonacci Retracement
- Bound or unbound retracements
- Customizable levels (0%, 23.6%, 38.2%, 50%, 61.8%, 100%)
- Adjustable colors and opacity
- Label customization
Channels
- Parallel equidistant channels
- Standard deviation channels
- Customizable fill and stroke
Text Annotations
- Custom font size, family, and weight
- Background color and text color
- Positioning anywhere on chart
Saving and Exporting
Save Chart
Click the Save button in the top menubar to preserve:
- All drawings and annotations
- Active indicators and their settings
- Chart type and style
- Timeframe selection
Export Snapshot
Click the Snapshot button to download the current chart view as a PNG image with:
- High-resolution output (2x pixel ratio)
- Ticker symbol and timestamp in filename
- All visible elements included
Comparing Assets
Use the Compare feature to overlay multiple assets on the same chart:
- Add comparison symbol via search
- Percentage-based normalization
- Customizable line colors and styles
- Only one comparison asset at a time
Tips for Effective Chart Analysis
- Combine indicators - Use multiple indicators together (e.g., RSI + MACD for confirmation)
- Use multiple timeframes - Analyze different timeframes for better context
- Save important setups - Preserve your analysis by saving charts
- Keyboard shortcuts - Speed up your workflow with drawing tool shortcuts
- Customize colors - Match your preferred color scheme for better readability
- Lock drawings - Prevent accidental modifications to important trend lines